Vimspector
This site goes through an example of how to use Vimspector to debug a C program (Vim) and covers basic usage.
Contents
- Getting Started
- UI Overview
- The code window
- The scopes window
- The watch window
- The call stack window
- The output window
- Debugging
Getting Started
A kind stranger (Igor Iranto) wrote up a really nice tutorial which is well worth a read.
In order to follow along at home, have a read of these instructions. They cover installing Vimspector and overview configuring it to debug Vim, as an example of a C program.
See also the detailed configuration documentation and the
JSON schema covering the .vimspector.json and .gadgets.json
formats.
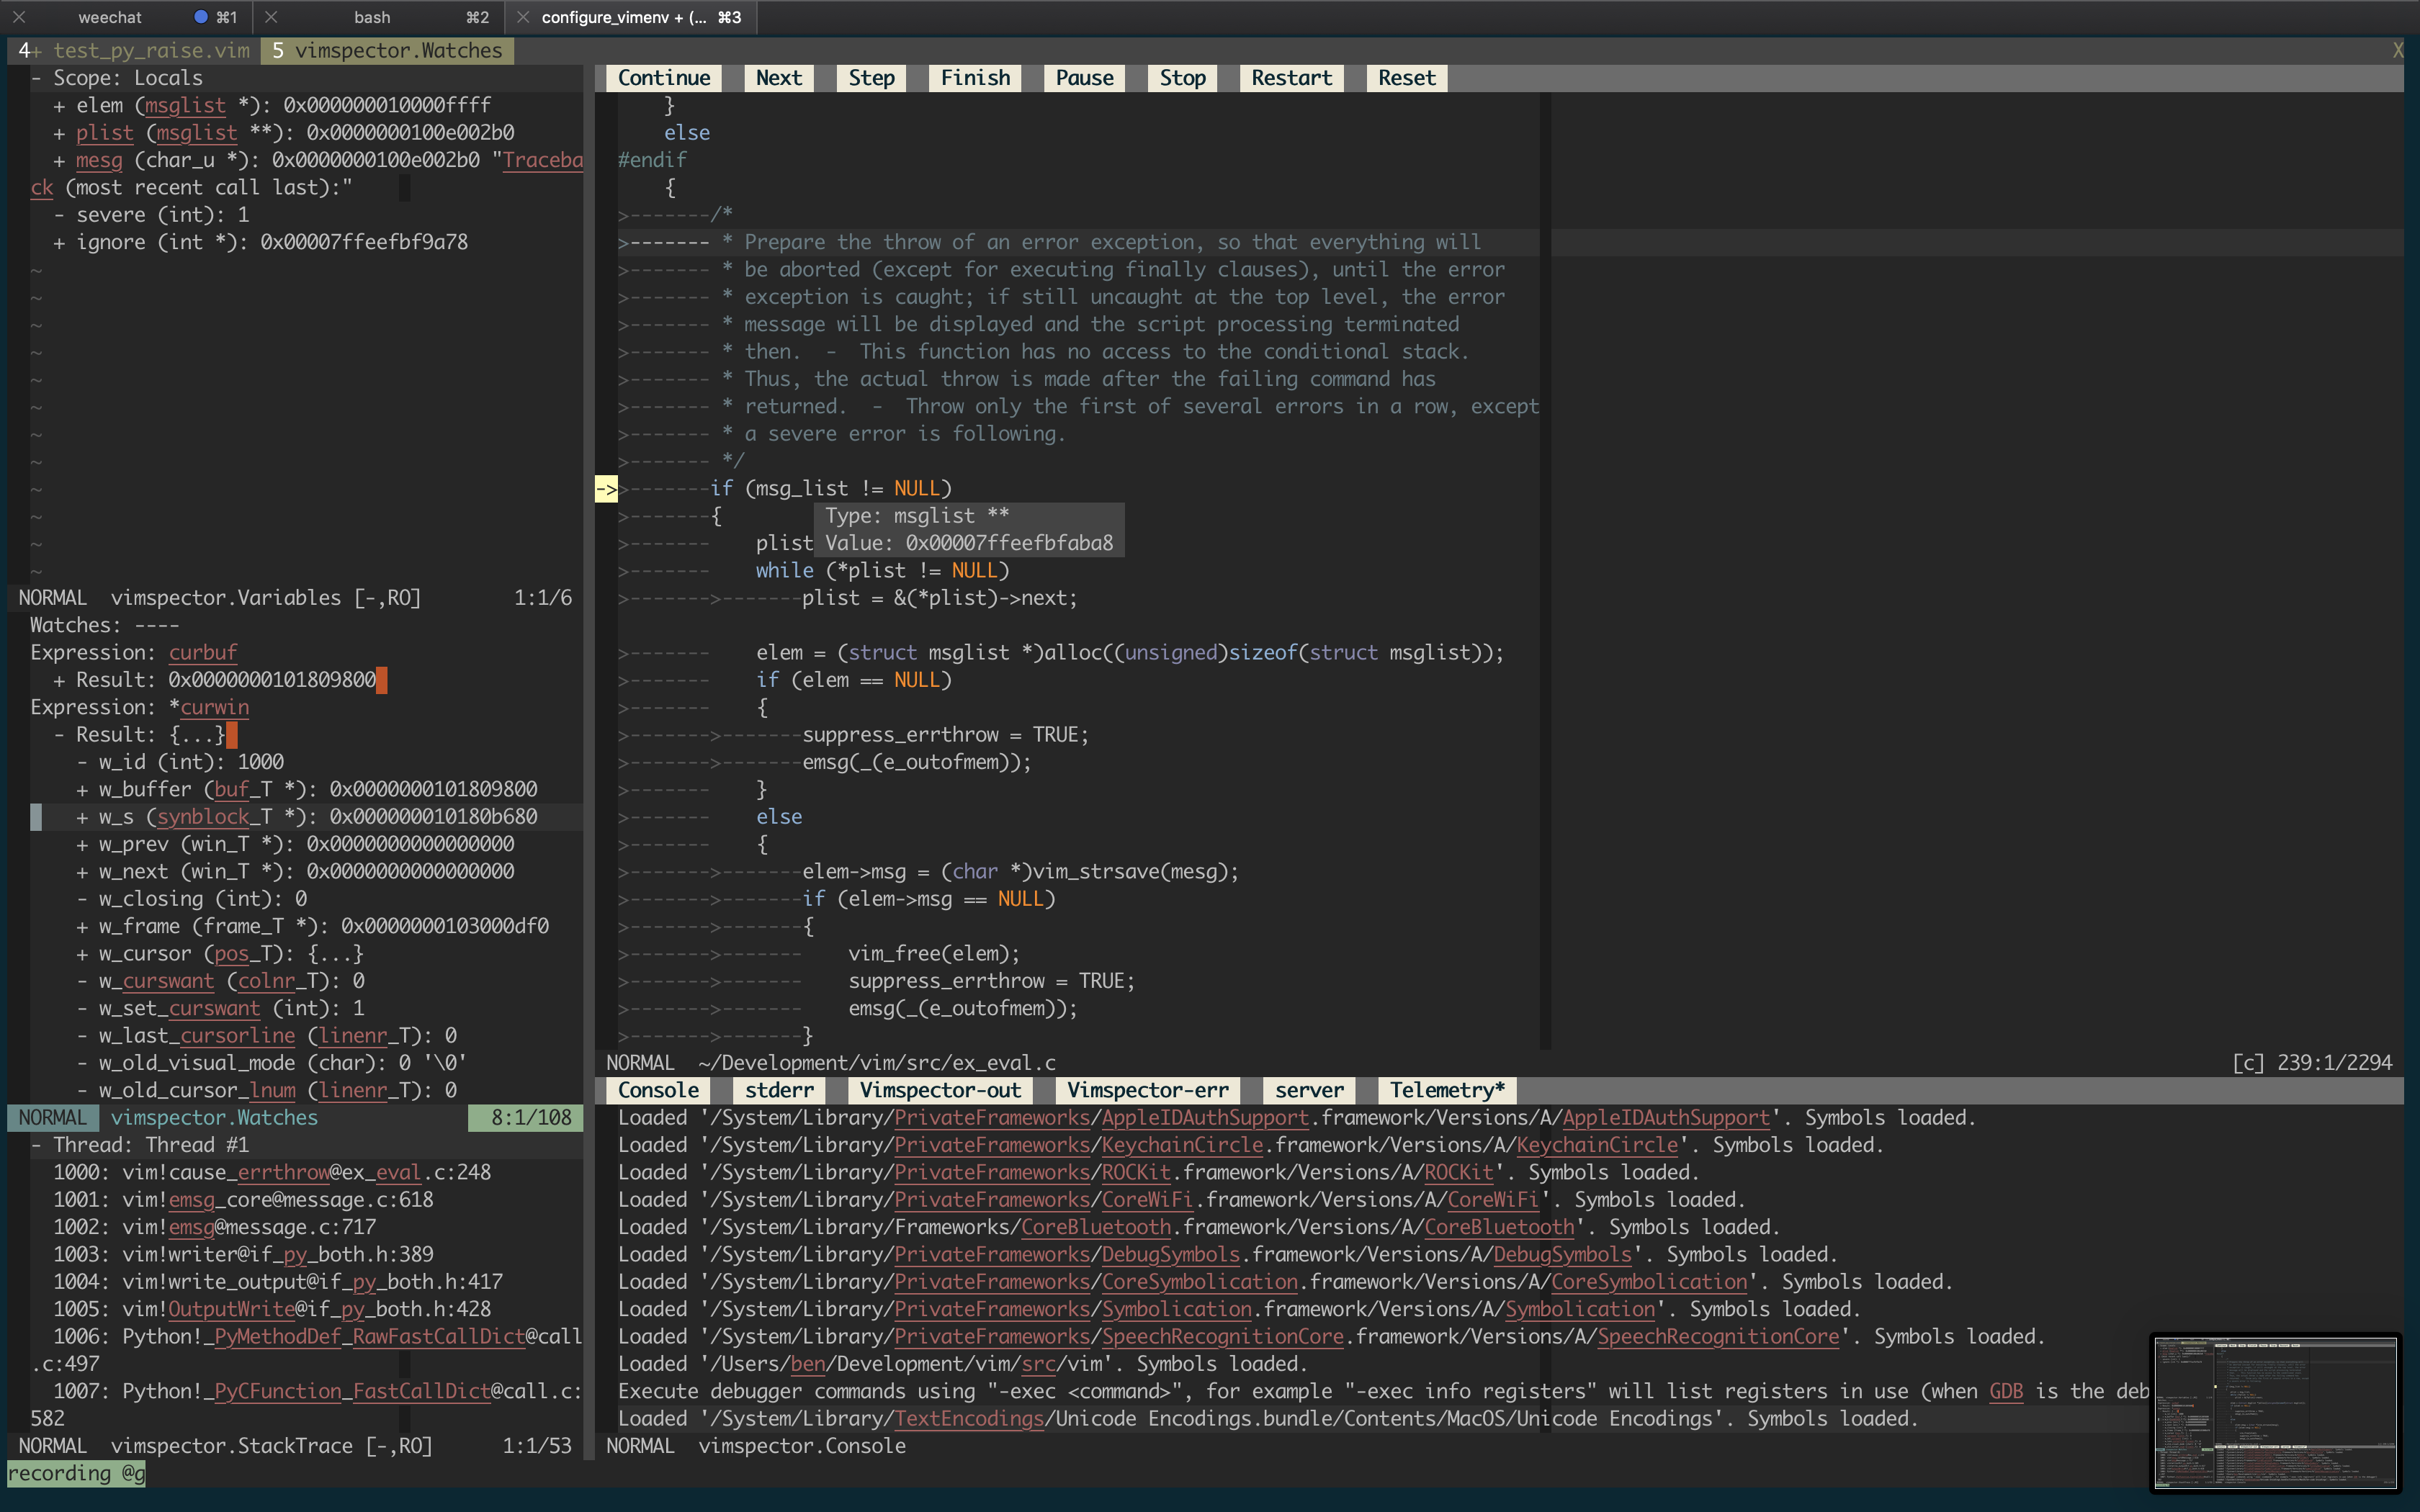
UI Overview
When starting debugging, vimspector creates a new tab page with 5 main sections:
- The code window
- The scopes window
- The watch window
- The call stack window.
- The output window
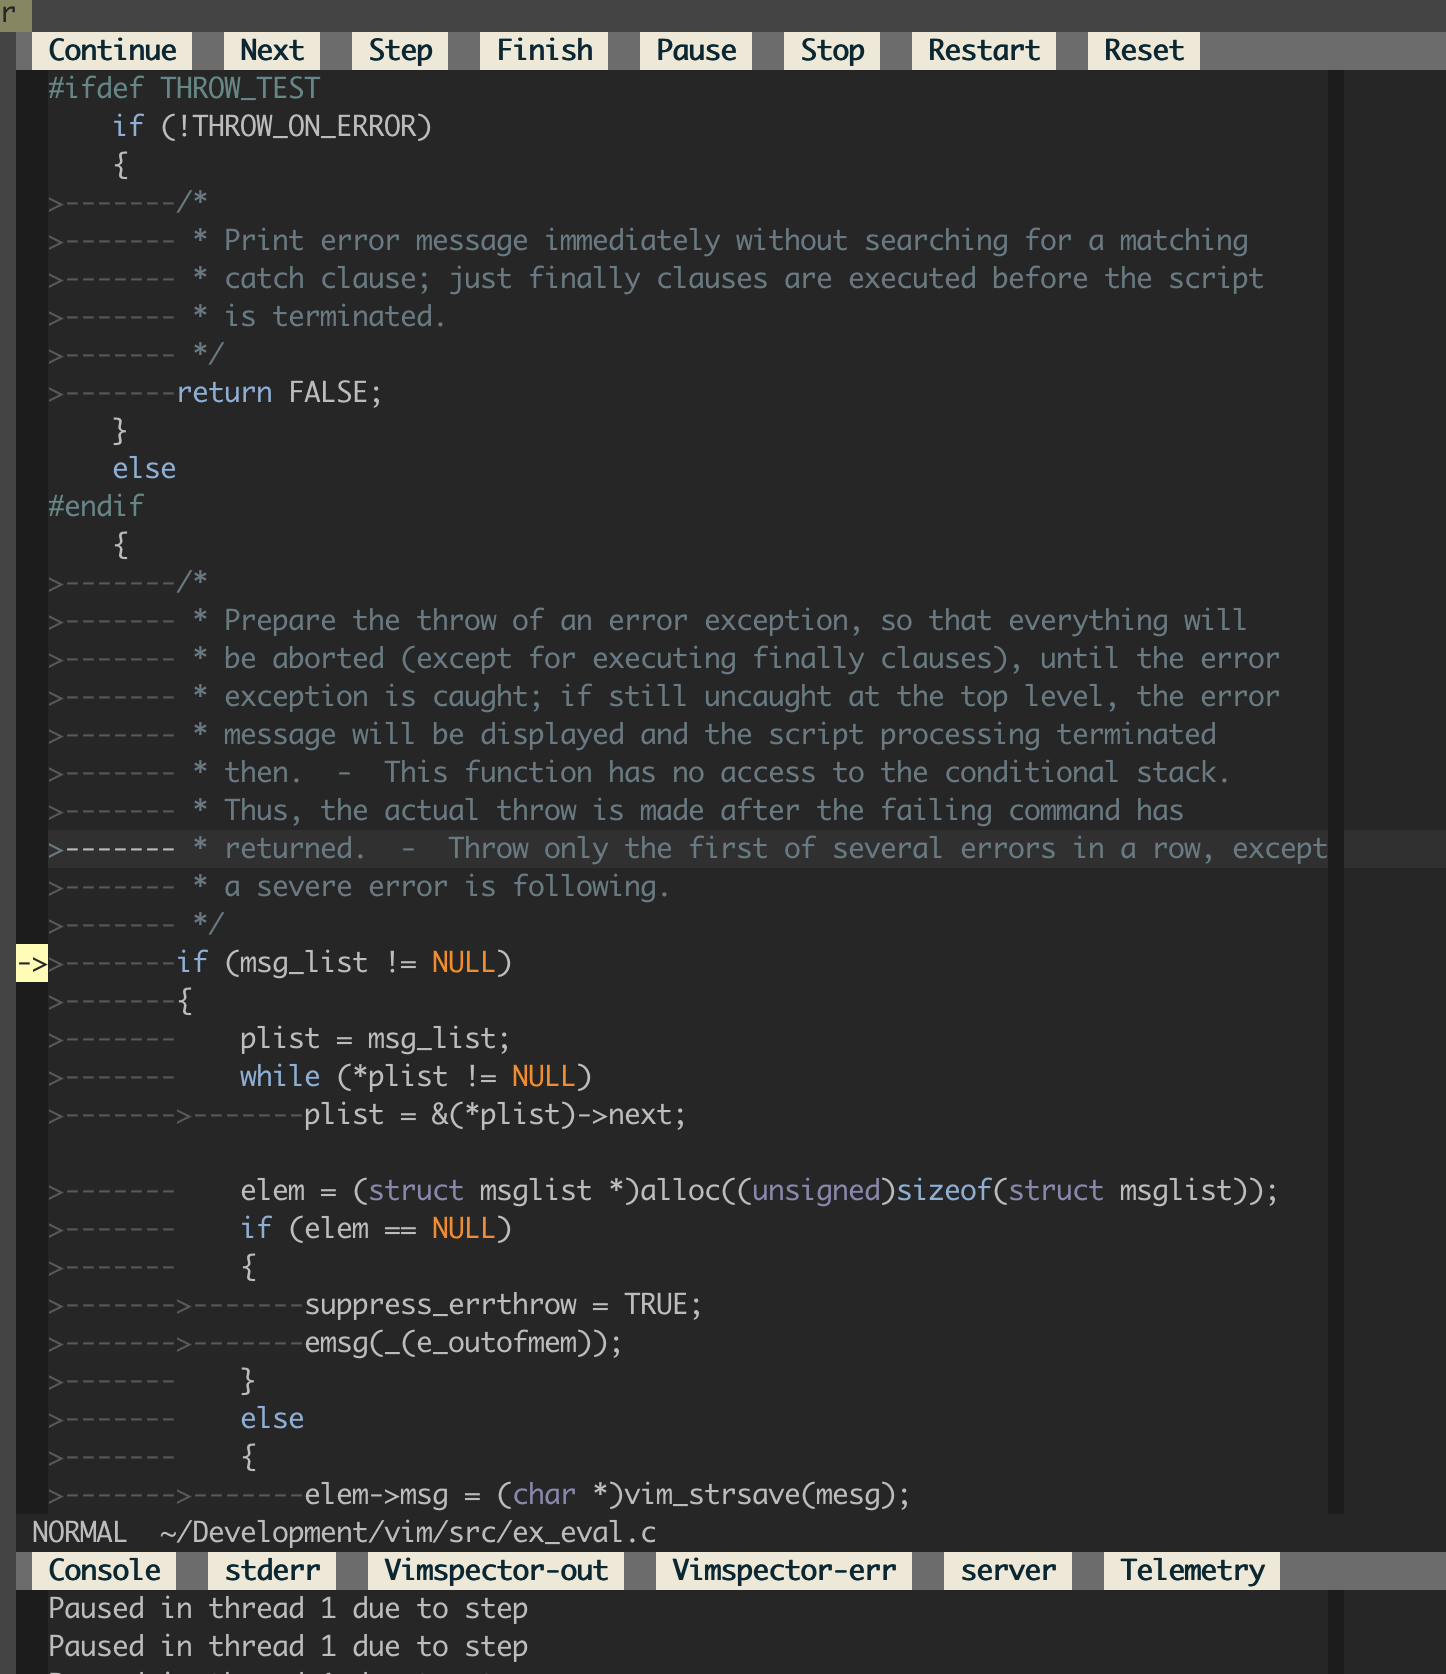
The code window
This window has 2 elements:
- The debug toolbar (WinBar), and
- The code buffer.
In the code buffer, the current line is highlighted with a sign. When selecting a stack frame in the call stack, the code window is updated to display the current line in that stack frame:
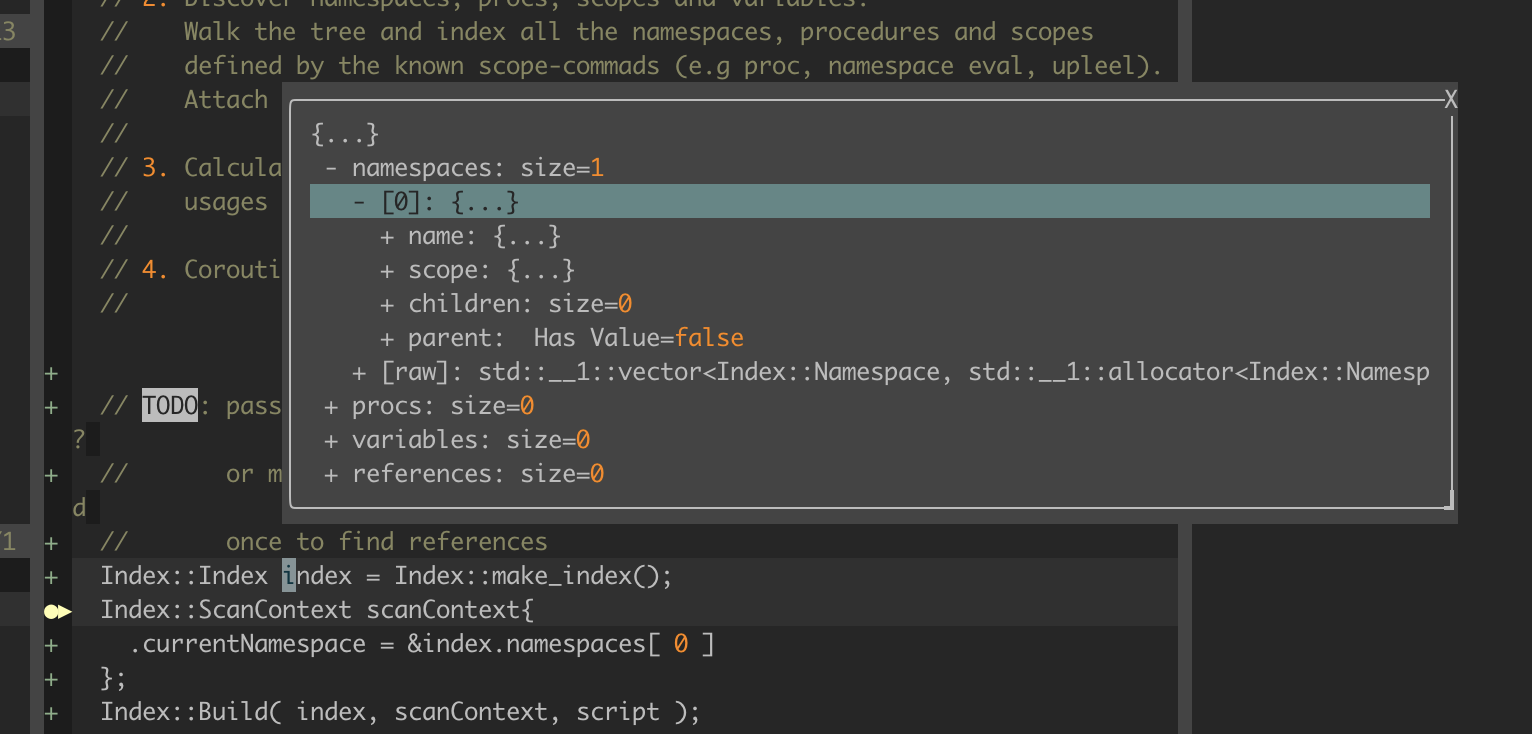
You can even get a pop up with the vaue of the expression under the cursor.
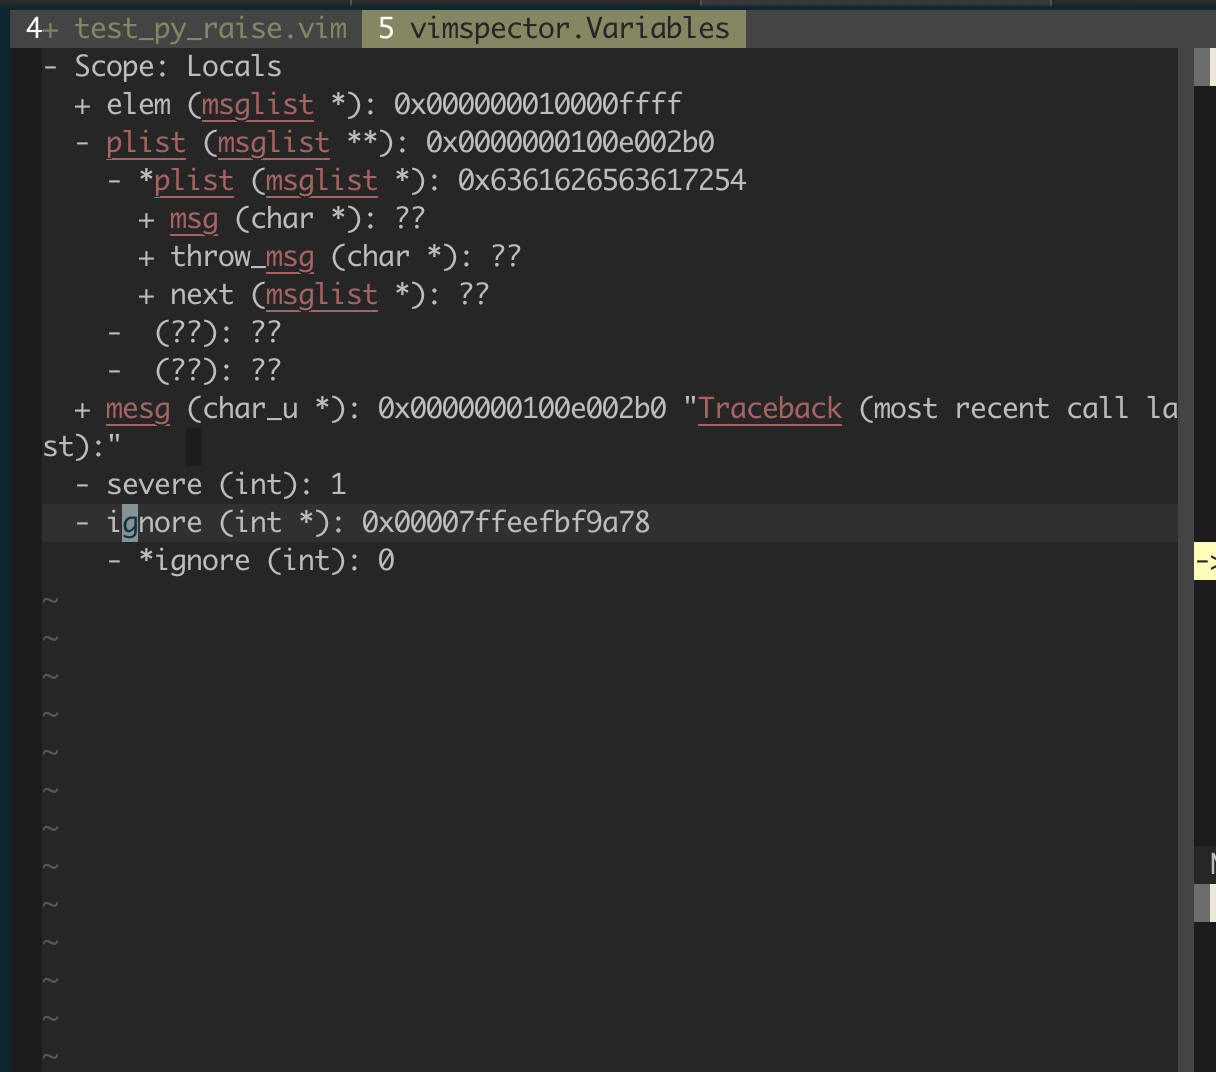
The scopes window
Displays the variables in different visible scopes. Entries can be expanded by
putting the cursor on the line and pressing <CR>.
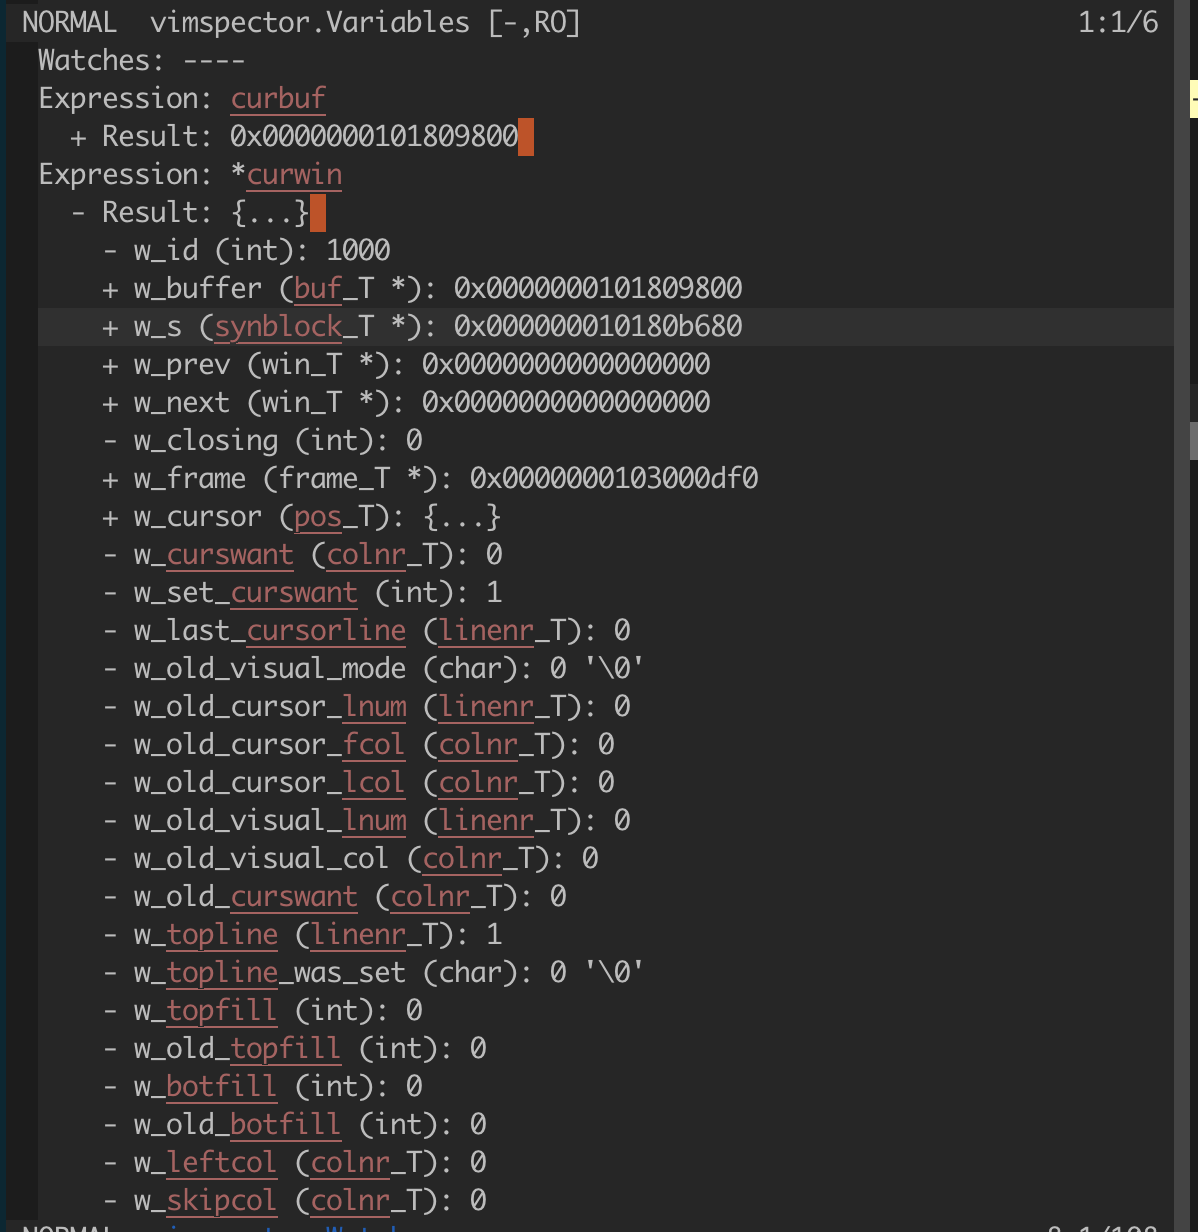
The watch window
Allows execution and display of arbitrary expressions. This window contains a
prompt buffer. When you enter insert mode (e.g. with i) you can type an
expression. When hitting <CR>, the expression is evaluated and the result is
displayed. If the result is has structure, it can be expanded like in the scoped
window by hitting <CR>. The little + and - icons show what is
expandable.
Watches are recomputed regularly so update as you’re stepping through code, for example.
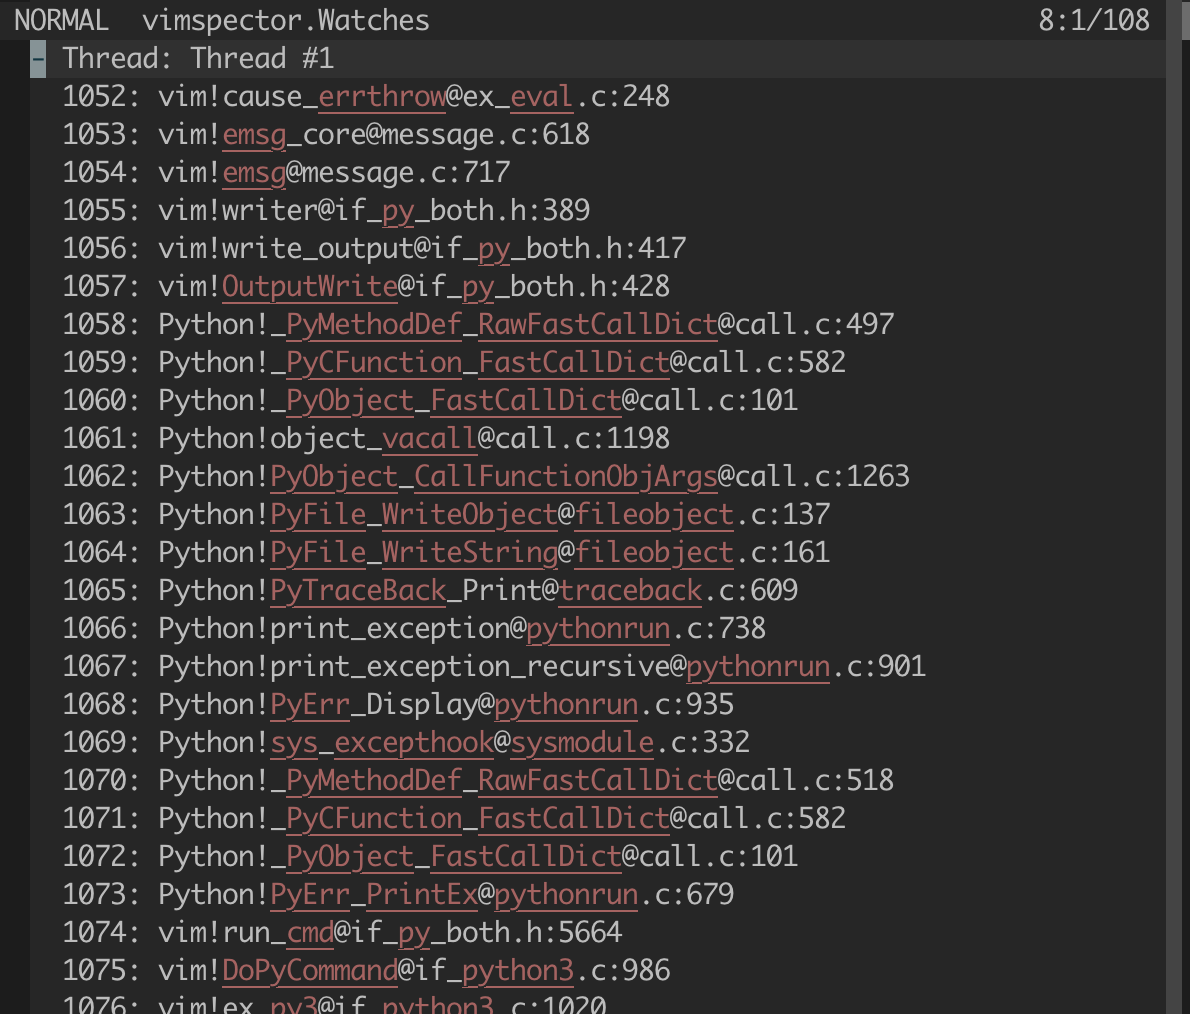
The call stack window
This shows the call stack for all of the threads in the program.
As with variables, stacks can be expanded and collapsed with <CR> and have
little + and - icons where appropriate. In addition, hitting <CR> on a
particular stack frame will open the file in the code window and place the
cursor there.
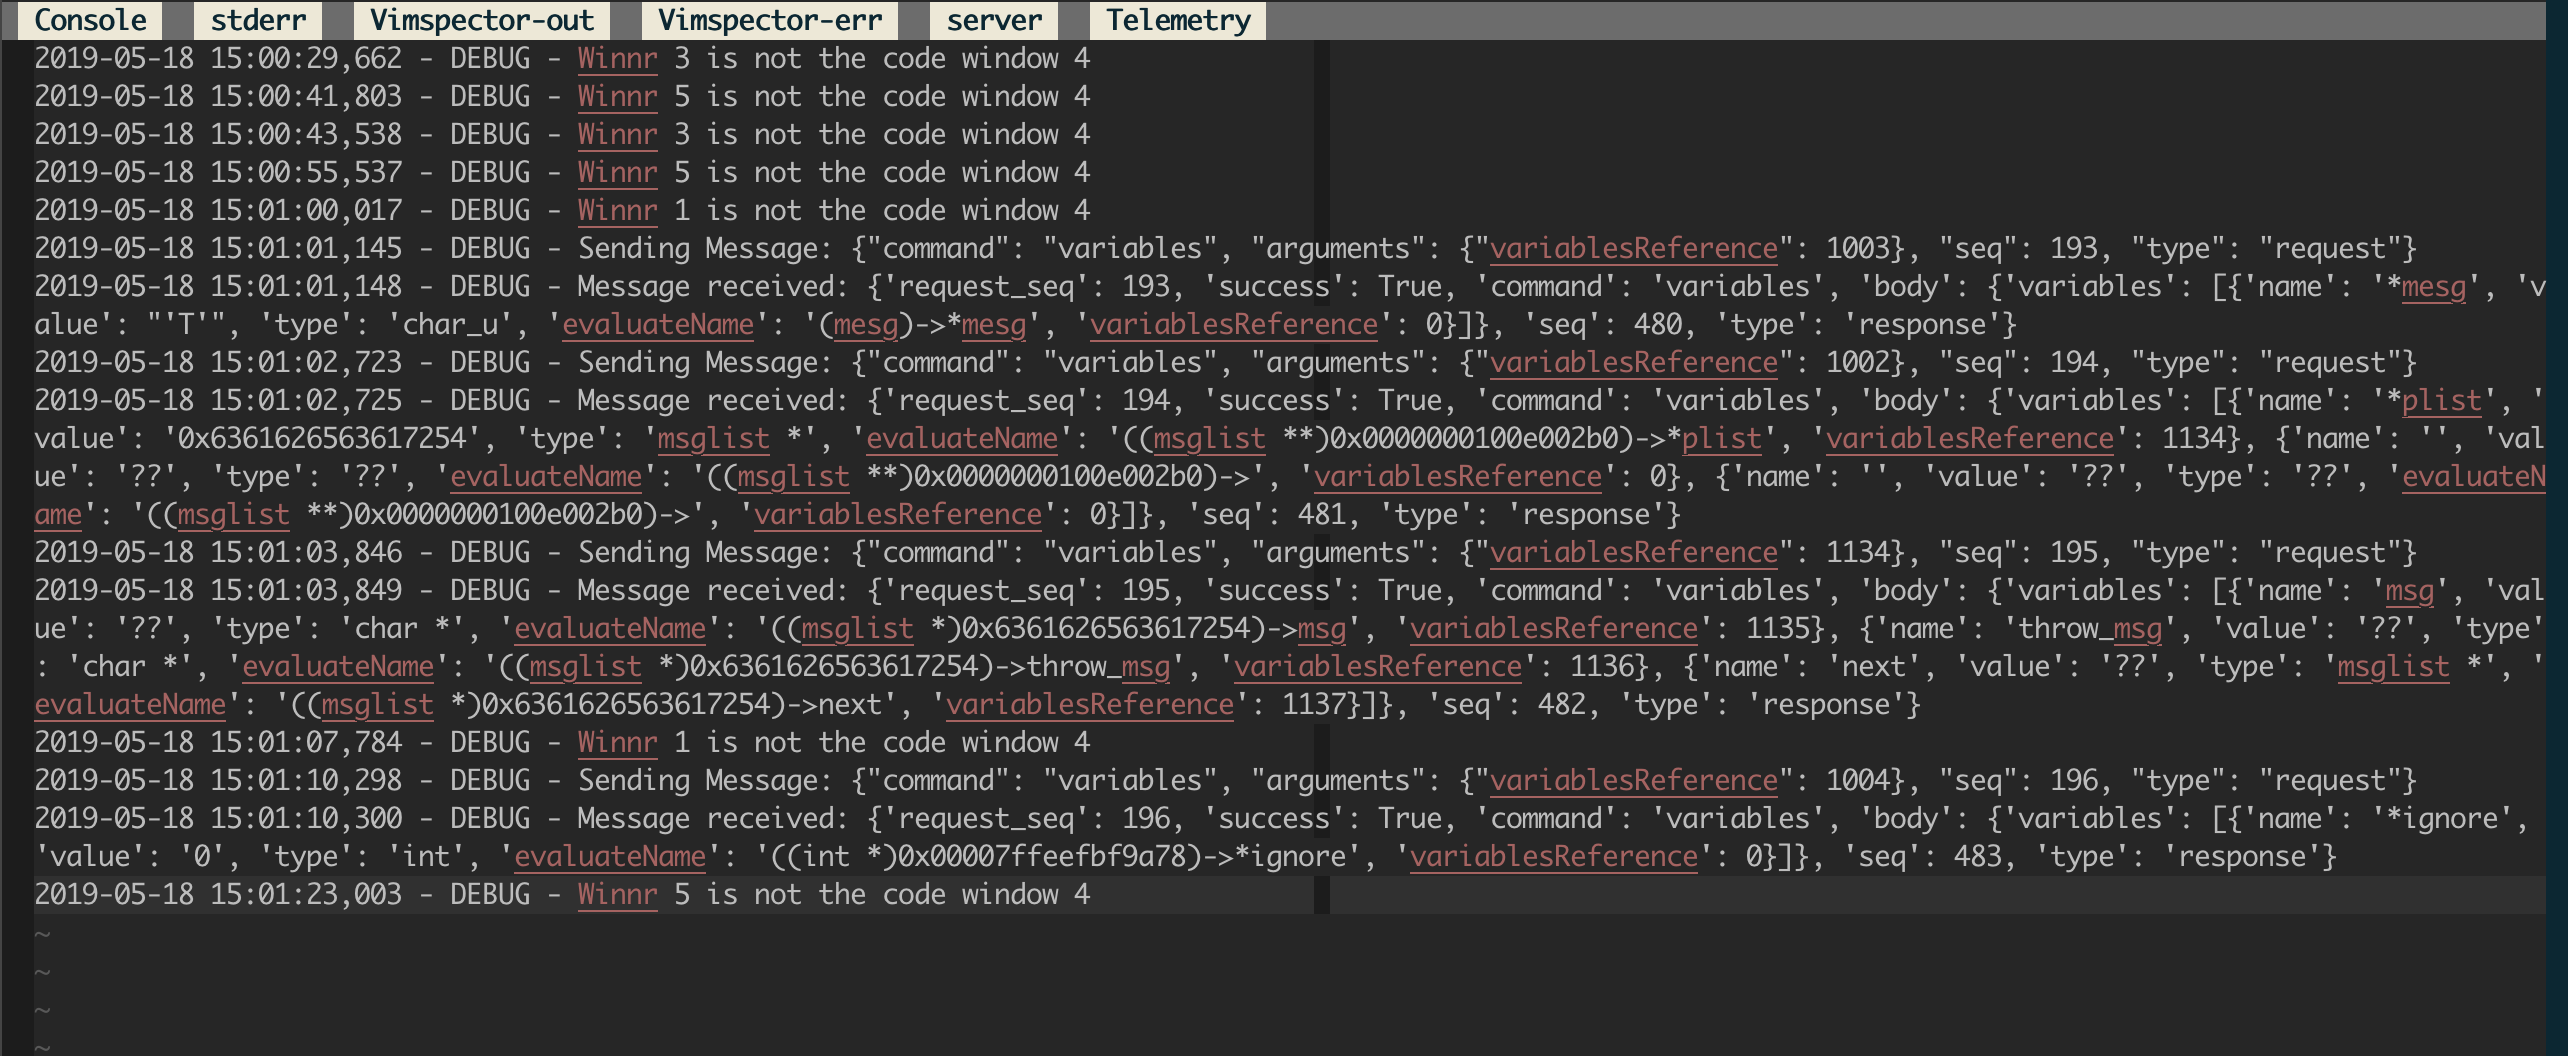
The output window
This contains a number of buffers for both monitoring debugger state an interracting with the debugger itself.
The most interesting buffers are:
- The Console, which allows for an interactive REPL with most debug adapters,
- The debugee standard error stream, and
- The vimspector log, which allows for debugging when vimspector breaks
These windows typically scroll automatically as new content is added asyncronously.
Debugging
For most debugging actions, I prefer the keyboard shortcuts, but if you are more mouse-inclined, the WinBar is quite useful.
Here’s a summary of common actions in the code windows. See the Vimspector readme for full details.
| Action | WinBar | Keyboard |
|---|---|---|
| Start debugging | None | <F5> |
| Continue until break | Continue | <F5> |
| Step over | Next | <F10> |
| Step into | Step | <F11> |
| Complete the current funcion | Finish | <F12> |
| Toggle breakpoint | None | <F9> |
| Stop debugging | Reset | <F3> |
| Start again with same options | Restart | <F4> |
| Interrupt the debugee | Pause | <F6> |
Other common actions use different windows:
| Action | Window | Instructions |
|---|---|---|
| View value of variable | Code Window | Hover the mouse on it |
| View variable/expression | Output Window | Click Console, i, enter expression, <CR> |
| View variable structure | Scopes Window | Highlight it and hit <CR> |
| View variable/expression | Watch Window | i then type expression, then <CR> |
| View backtrace | Stack Trace Window | Expand/collapse with <CR> |
| Jump to stack frame | Stack Trace Window | Put cursor on frame, hit <CR> |
| View process output | Output Window | stdout or stderr |
| Delete a watch expression | Watch Window | Cursor on it, press <DEL> |
| Run to cursor | Code Window | <F9>, <F5>, <F9> |
| Add a breakpoint while rnuning | Code Window | <F6>, … <F9>, <F5> |